Hi everyone!
I’m new to Pyro, so probably I’m missing something obvious.
Consider the following simple code:
import torch
import pyro
import pyro.distributions as dist
from pyro.infer.autoguide import AutoMultivariateNormal, init_to_mean
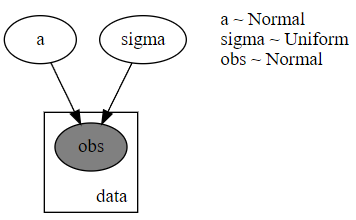
def model(x, y):
a = pyro.sample("a", dist.Normal(0., 10.))
sigma = pyro.sample("sigma", dist.Uniform(0., 10.))
with pyro.plate("data", len(x)):
pyro.sample("obs", dist.Normal(a, sigma), obs=y)
pyro.render_model(model, model_args=(torch.rand(1,1), torch.rand(1,1)), render_distributions=True)
guide = AutoMultivariateNormal(model, init_loc_fn=init_to_mean)
pyro.render_model(guide, model_args=(torch.rand(1,1), torch.rand(1,1)), render_distributions=True)
What render_model produces for the model itself is what I expect:
The question I have is about what it produces for the autoguide:
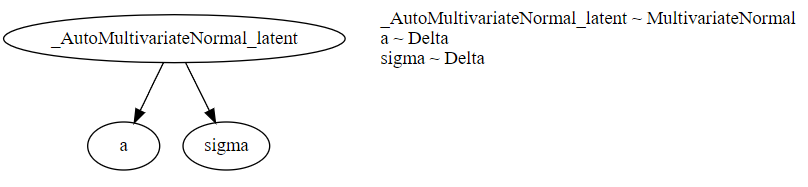
Why does it show Delta distribution for parameters a and sigma?
If I sample from that guide I actually get what looks like a multi-variate Gaussian.
Is it just a visual bug? Maybe it was a design choice, if so I don’t understand why.
Thanks for your help 