Hi
I’ve been working on a project similar to this paper (https://arxiv.org/pdf/1905.09299.pdf) basically you fit a Gaussian process using posterior samples and can then generate more samples by running mcmc taking the gaussian process to be the likelihood ( + prior) . This is advantageous for example if your likelihood is slow to evaluate (and lots of other reasons)
My question is, if I’ve managed to fit a GP (using GPytorch ) how can I pass this to the model used by pyro or numpyro in mcmc. This would be easy to do in something like emcee but I can’t quite see what the parallel would be in pryo .
I think the main problem is don’t fully understand how the sample handler would work in a situation where I have an arbitrary likelihood function rather than a standard distribution ? I also don’t understand how this would work as there is no observed data i.e. I’m not fitting anything to data I just want to draw samples according to the fitted GP posterior surface
Hi Thanks for your reply it’s been really helpful, I’m able to make the code run now but it doesn’t seem to be converging towards the correct model. The correct posterior should be a 2d gaussian but currently it’s just returning a 2d uniform which would appear to be just sampling from the priors I’ve given. My code is the following :
Hi @rgreen1995, pyro.sample takes a distribution object as the second parameter which when called returns a sample from the particular distribution. In your case gp_prob(a, b) is just a regular numpy array, and that’s what Pyro is complaining about.
With the current interface in Pyro’s dev branch, I’m not sure if you even need to define a model, but you will need to appropriately transform x, y from constrained ([0, 10] interval that is) to unconstrained domain in your potential function if you don’t use Pyro’s modeling semantics. With your example too, you can probably inject a log density term as follows (not tested):
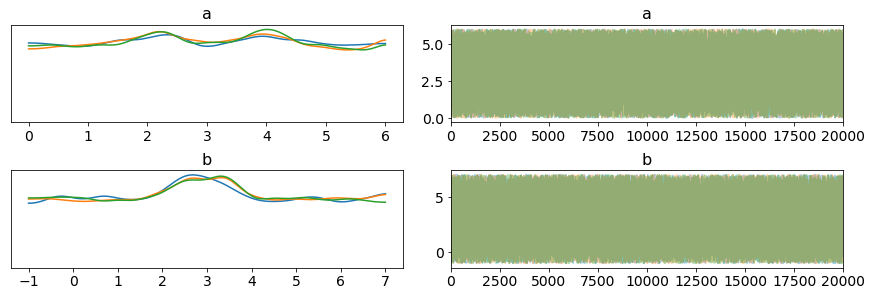
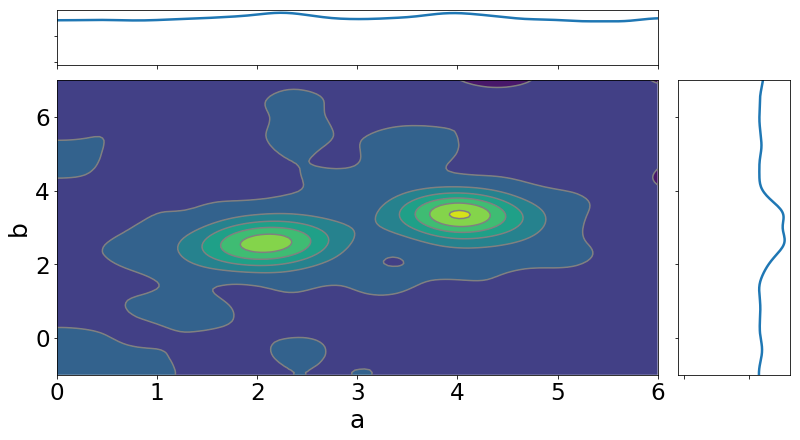
Hi thanks again everyone for the help, @neerajprad that seems to work ! however the output is a bit strange, it seems to find the correct posterior in the high density areas,but the contrast between high and low probability regions doesn’t seem to be reflected by the samples So even after 20000 iterations the sampler is still drawing points where there should be almost zero support. The plots below show this point point clearly.
It is hard to say without examining the model run. I have some questions / tips for further debugging:
All the operations on a, b in gp_prob should be torch operations so that they are visible to the autograd engine. Therefore conversion to numpy might be problematic. Pyro’s HMC needs to be able to compute the derivative of your PE function w.r.t. all the sample parameters.
What is the acceptance rates that you are seeing in your sampling? And what are the neff and r_hat statistics from mcmc.summary()?
For b, why do we see values like -1? That should clearly be outside the support. Are you plotting the constrained or unconstrained values?
Could you also try other priors like a half cauchy prior?