I was running a GP regression on my data using a RBF kernel:
pyro.clear_param_store()
#convert RSL data into tonsors
X = torch.tensor(NJ_rsl_age).flatten() #standardise age
y = torch.tensor(NJ_rsl).flatten()
y_sigma = torch.tensor(NJ_rsl_2sd/2).flatten()
#generate a RBF kernel
RBF_kernel = gp.kernels.RBF(input_dim=1)
RBF_kernel.set_prior(“variance”, dist.Uniform(torch.tensor(0.5), torch.tensor(40)))
RBF_kernel.set_prior(“lengthscale”, dist.Uniform(torch.tensor(0.5), torch.tensor(10000)))
gpr = GPRegression(X, y, RBF_kernel,noise=torch.tensor(y_sigma),jitter=1e-5)
#optimize RBF kernel with Adam optimizer
optimizer = torch.optim.Adam(gpr.parameters(), lr=0.01)
loss_fn = pyro.infer.Trace_ELBO().differentiable_loss
losses =
num_steps = 2000 if not smoke_test else 2
for i in range(num_steps):
optimizer.zero_grad()
loss = loss_fn(gpr.model, gpr.guide)
loss.backward()
optimizer.step()
losses.append(loss.item())
plot_loss(losses)
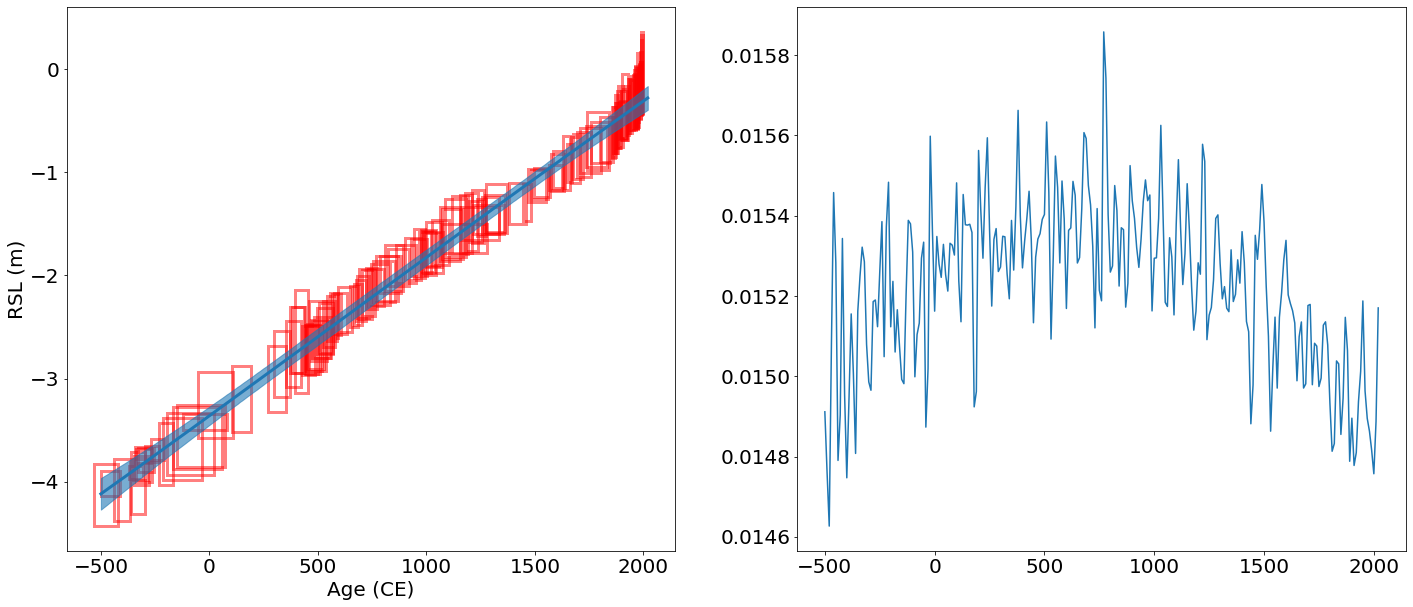
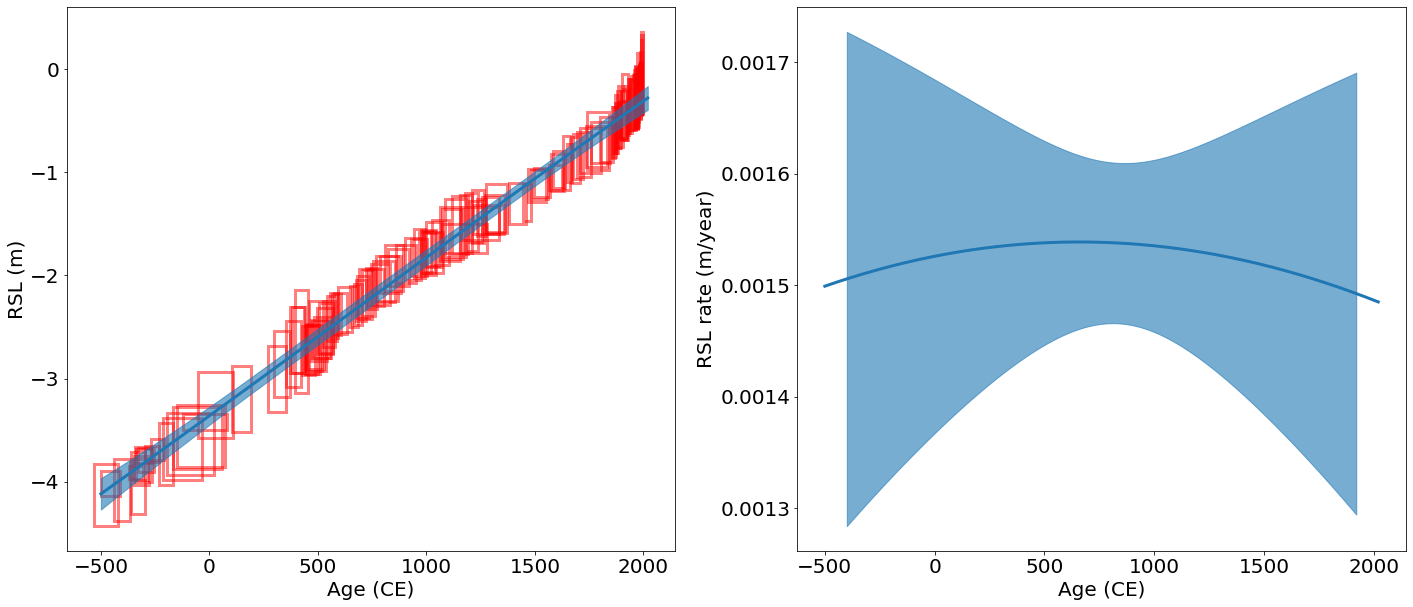
However, when I try to calcualte the varaince about the first derivative of the output, I found the first derivative of GP preditive mean is very noisy, I am wondering why is that and how can I fix it?
x_test = torch.arange(-500,2025,10.,requires_grad=True)
y_mean, y_var = gpr(x_test.float(), full_cov=True,noiseless=True)
sd = torch.diag(y_var).sqrt() # standard deviation at each input point x
fig= plt.figure(figsize=(24, 10))
ax = plt.subplot(121)
ax = PSTHM.plot_uncertainty_boxes(NJ_rsl_age,NJ_rsl, NJ_rsl_age_2sd,NJ_rsl_2sd,ax=ax)
plt.plot(x_test.detach().numpy(),y_mean.detach().numpy(),linewidth=3)
ax.fill_between(
x_test.detach().numpy(), # plot the two-sigma uncertainty about the mean
(y_mean - 2.0 * sd).detach().numpy(),
(y_mean + 2.0 * sd).detach().numpy(),
color=“C0”,
alpha=0.6,zorder=10)
ax = plt.subplot(122)
plt.plot(x_test.detach().numpy(),np.gradient(y_mean.detach().numpy()))