Membership probability of data elements in Mixture distribution

Hi there,
I am trying to fit a mixture of Gaussians to my data. I got two questions:

  1. Is the approach I am using the right one?
  2. How can assign membership probabilities to each data point? I mean, I would like to know the probability of each data point belonging to one of the Gaussians.

Here is my code.

def model(data):
    w = jnp.array([0.7, 0.3])
    weights = numpyro.sample("weights", dist.Dirichlet(w))

    mu_main = numpyro.sample("mu_main", dist.Normal(0, 5))
    std_main = numpyro.sample("std_main", dist.Uniform(0, 20)) # consider using dist.LogNormal
    
    mu_side = numpyro.sample("mu_side", dist.Normal(-10, 30))
    std_side = numpyro.sample("std_side", dist.Uniform(5, 30))

    numpyro.sample("obs", dist.MixtureSameFamily(dist.Categorical(probs=jnp.array(weights)), dist.Normal(loc=jnp.array([mu_main, mu_side]), scale=jnp.array([std_main, std_side]))), obs=data)


Thanks in advance.

Medrano.

I think the approach is right. To get the membership probability of each data point, you can look at the weights variable in your model.

Thanks @fehiepsi

If I access the model results with get_samples for instance, I get the probabilities over the length of the sample. I would like these probabilities for each data point (over the length of the data). Do I have to iterate inside the model (with a plate) over the length of the data and do something (what exactly I don’t know)?

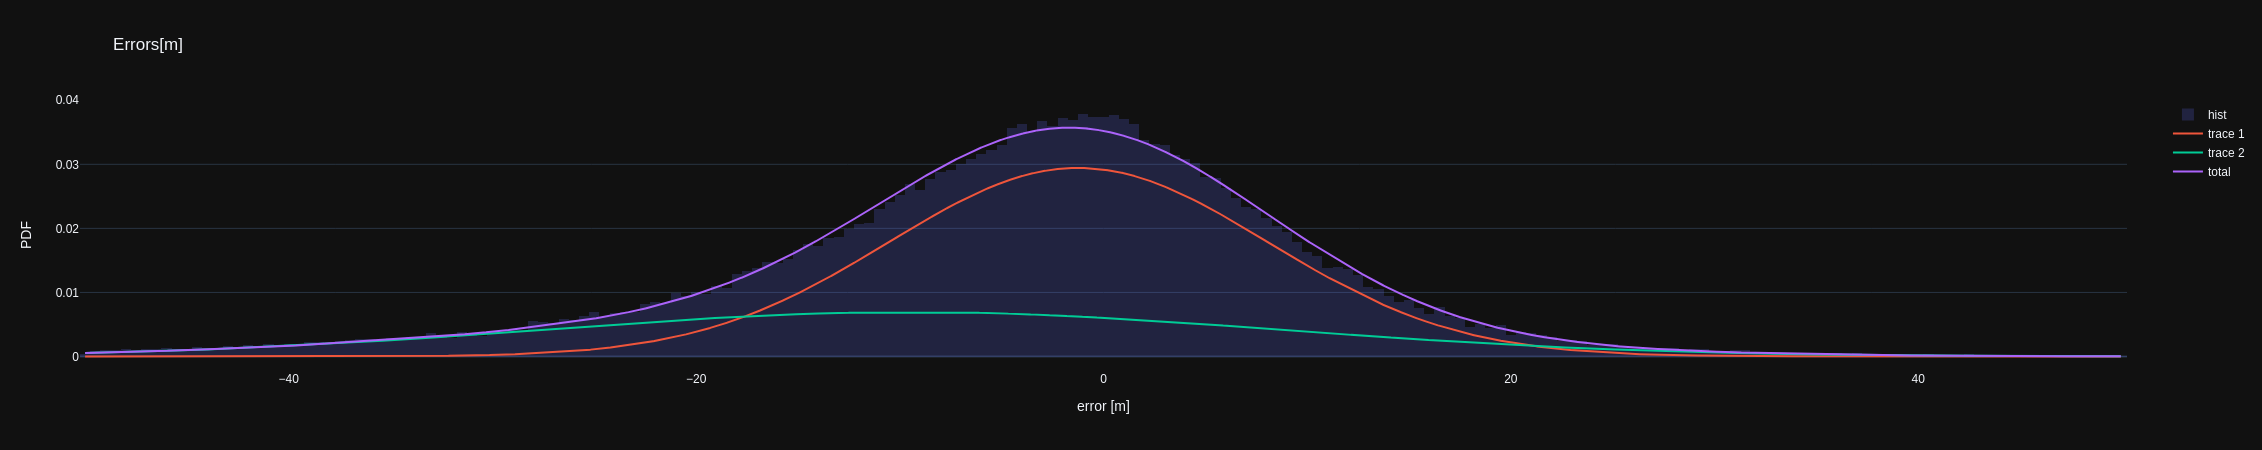
In the data I have, one of the components is clearly larger than the other (this is why I assigned the weights to be 0.7 and 0.3, respectively). See the plot below. However, in the results I get, the weights are about 50, 50.

               mean       std    median      5.0%     95.0%     n_eff     r_hat
   mu_main     -0.99      0.07     -0.99     -1.10     -0.88   1910.31      1.00
   mu_side     -7.05      0.12     -7.05     -7.26     -6.86   1856.53      1.00
  std_main      8.05      0.08      8.05      7.93      8.18   1512.96      1.00
  std_side     16.86      0.10     16.86     16.70     17.03   1525.46      1.00
weights[0]      0.53      0.01      0.53      0.52      0.55   1288.68      1.00
weights[1]      0.47      0.01      0.47      0.45      0.48   1288.68      1.00

Number of divergences: 0

Any additional hints are much appreciated.

Sorry, my last comment is wrong. I guess you can do:

d = mixture_distribution
log_probs = d.component_distributions.log_prob(data.unsqueeze(-1)) + d.mixing_distributions.logits
probs = softmax(log_probs, axis=-1)
# optional: store this probs in the trace
numpyro.deterministic("probs", probs)

If you use the dev branch (or the latest release), you can do

log_probs = d.component_log_probs(data)
numpyro.deterministic("probs", softmax(log_probs, -1))
1 Like