@martinjankowiak here’s the code
Imports:
import pandas as pd
import numpy as np
import matplotlib.pyplot as plt
import seaborn as sns

import jax
import jax.numpy as jnp
from jax import random
import numpyro
import numpyro.distributions as dist
from numpyro.infer import MCMC, NUTS

numpyro.set_platform('cpu')
numpyro.set_host_device_count(4)
numpyro.enable_x64()

seed = random.PRNGKey(0)
Data simulation:
n_subject = 2
n_segment = 3

a = jnp.array([
    [2.4, 3.2, 5.4],
    [2.53, 3.5, 5.9]
])

b = jnp.array([
    [3.4, 3.9, 3.1],
    [4.1, 3.99, 4.2]
])

n_points = 40
x = jnp.linspace(0, 10, n_points)

df = None

for i in range(n_subject):
    for j in range(n_segment):
        subject = jnp.repeat(i, n_points)
        segment = jnp.repeat(j, n_points)

        if not i and j:
            mean = jnp.minimum(jnp.maximum(
                0, b[i, j] * (x - a[i, j])
            ), 9)
        else:
            mean = jax.nn.relu(
                b[i, j] * (x - a[i, j])
            )

        y = dist.TruncatedNormal(mean, .5, low=0).sample(seed, (1,))

        if df is None:
            df = pd.DataFrame(
                jnp.array([subject, segment, x, y.reshape(-1,)]).T,
                columns=['subject', 'segment', 'x', 'y']
            )
        else:
            temp = pd.DataFrame(
                jnp.array([subject, segment, x, y.reshape(-1,)]).T,
                columns=['subject', 'segment', 'x', 'y']
            )
            df = pd.concat([df, temp], ignore_index=True).copy()

df.subject = df.subject.astype(int)
df.segment = df.segment.astype(int)
Plot simulated data:
fig, ax = plt.subplots(n_subject, n_segment, figsize=(12,6), constrained_layout=True)

for i in range(n_subject):
    for j in range(n_segment):
        sns.scatterplot(x='x', y='y', ax=ax[i][j], data=df[(df.subject == i) & (df.segment == j)])
        ax[i][j].set_ylabel('Y')
        ax[i][j].set_xlabel('X')
        ax[i][j].set_title(f'Subject {i}, Segment {j}')
Looks like this:
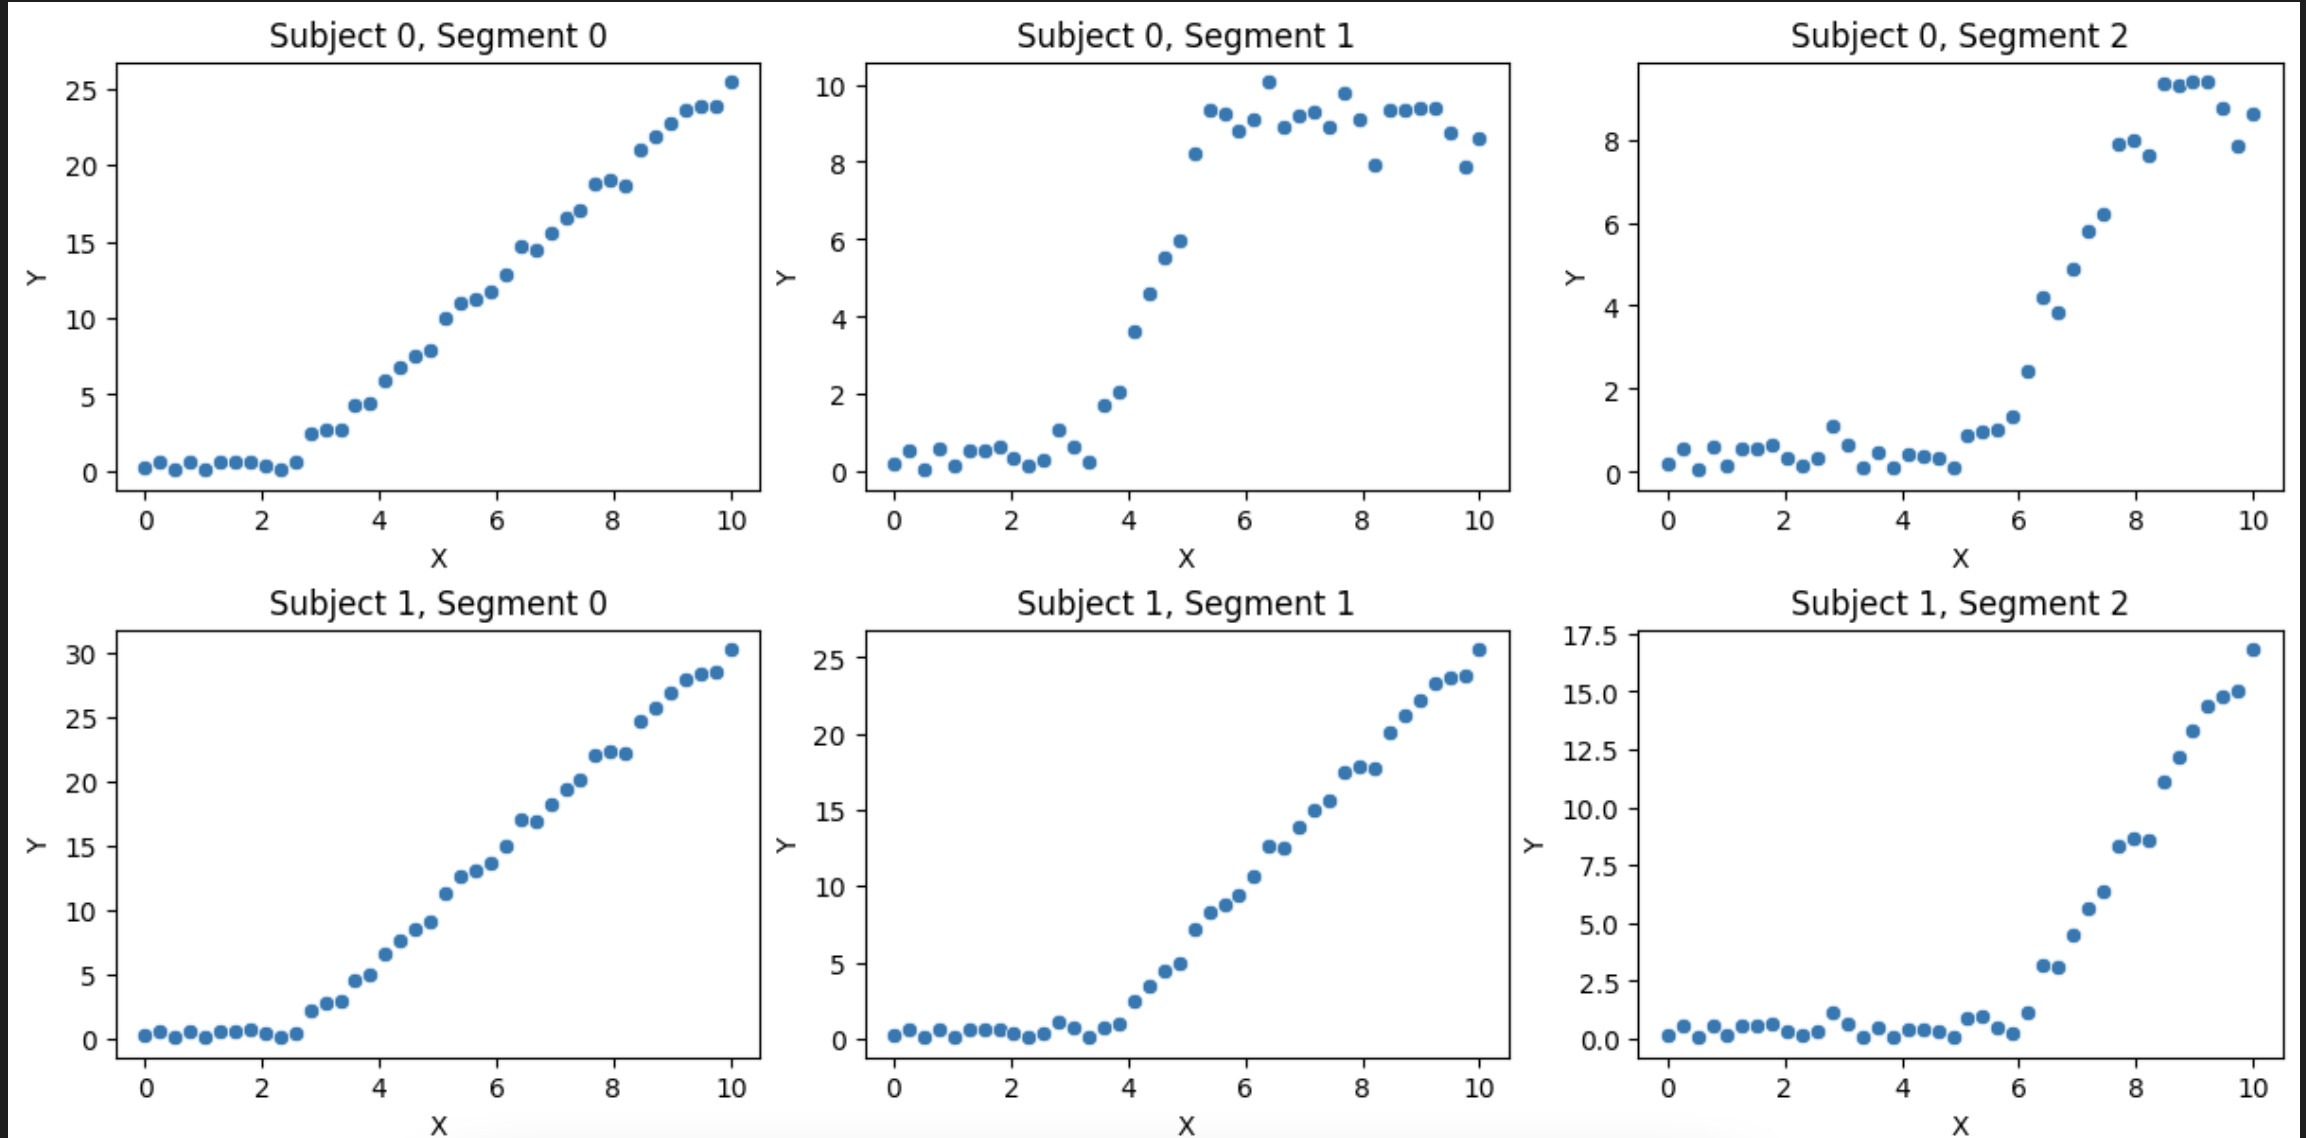
As you can see, the data only saturates when subject = 0 and segment = 1, 2. So I want to fit from two parametric families: one being Relu and other being Relu that saturates (kind of like sigmoid)
Curve fitting with parametric family set to: Relu that saturates
def model(x, subject, segment, y_obs=None):
    n_subject = np.unique(subject).shape[0]
    n_segment = np.unique(segment).shape[0]

    with numpyro.plate("n_segment", n_segment, dim=-1):
        with numpyro.plate("n_subject", n_subject, dim=-2):
            a = numpyro.sample('a', dist.Normal(3, 1))
            b = numpyro.sample('b', dist.Normal(3, 1))

            c = numpyro.sample('c', dist.Normal(9, 1))

    mean = jnp.minimum(jnp.maximum(
        0, b[subject, segment] * (x - a[subject, segment])
    ), c[subject, segment])

    with numpyro.plate("data", len(x)):
        return numpyro.sample("obs", dist.TruncatedNormal(mean, .5, low=0), obs=y_obs)

x = df.x.to_numpy().reshape(-1,)
subject = df.subject.to_numpy().reshape(-1,)
segment = df.segment.to_numpy().reshape(-1,)
y = df.y.to_numpy().reshape(-1,)

# MCMC
nuts_kernel = NUTS(model)
mcmc = MCMC(nuts_kernel, num_chains=4, num_warmup=2000, num_samples=4000)
rng_key = jax.random.PRNGKey(0)
mcmc.run(rng_key, x, subject, segment, y)
posterior_samples = mcmc.get_samples()
Plot results
a = posterior_samples['a'].mean(axis=0)
b = posterior_samples['b'].mean(axis=0)
c = posterior_samples['c'].mean(axis=0)

fig, ax = plt.subplots(n_subject, n_segment, figsize=(12,6), constrained_layout=True)

for i in range(n_subject):
    for j in range(n_segment):
        sns.scatterplot(x='x', y='y', ax=ax[i][j], data=df[(df.subject == i) & (df.segment == j)])
        ax[i][j].set_ylabel('Y')
        ax[i][j].set_xlabel('X')
        ax[i][j].set_title(f'Subject {i}, Segment {j}')

        mean = jnp.minimum(jnp.maximum(
            0, b[i, j] * (x - a[i, j])
        ), c[i, j])

        sns.lineplot(x=x, y=mean, ax=ax[i][j], color = 'red')
which looks like this
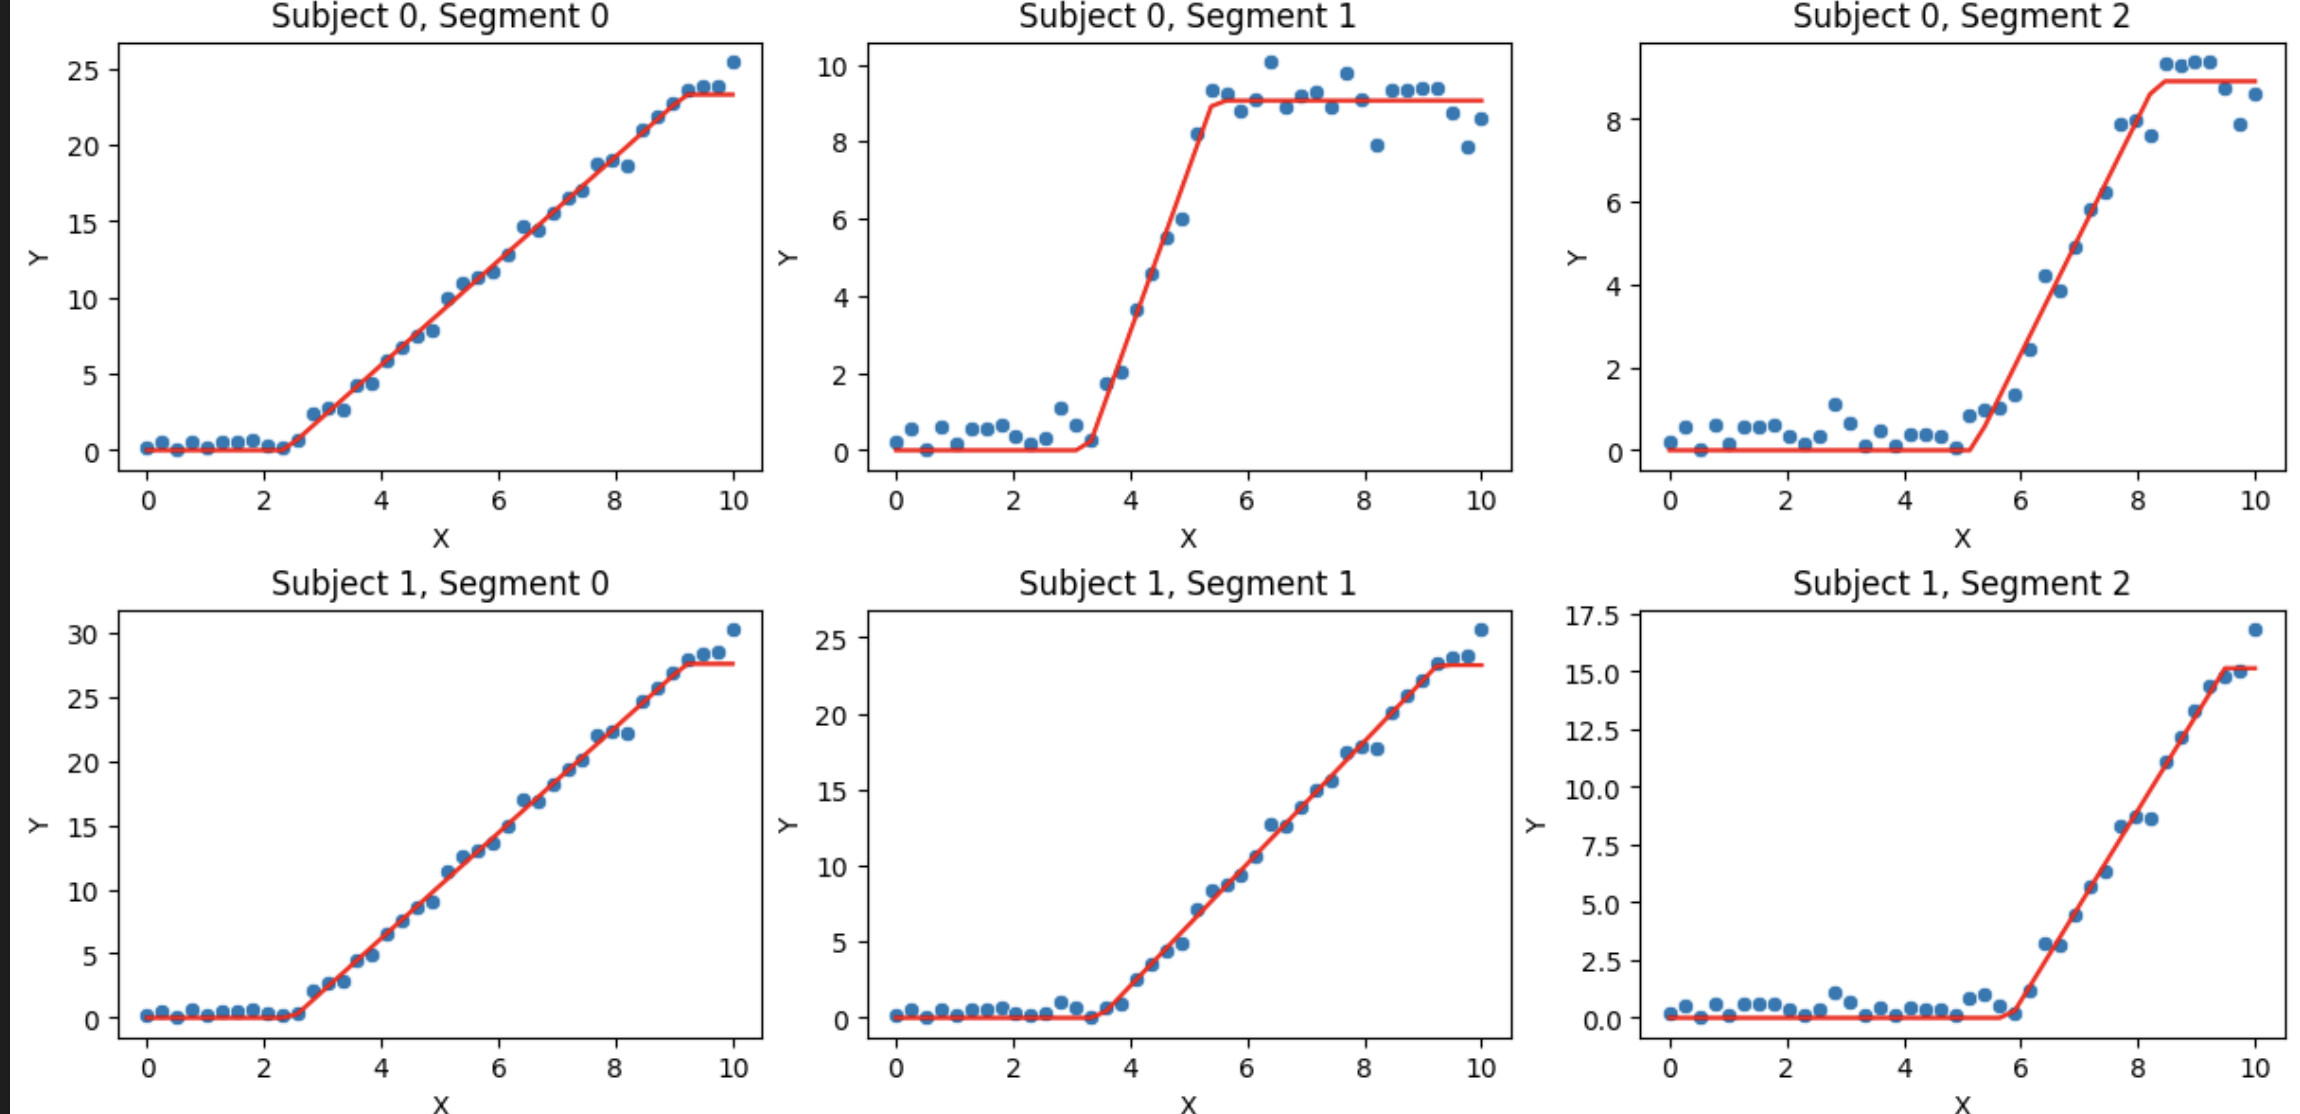
Now, I will change my model to fit from both the parametric families
def model(x, subject, segment, y_obs=None):
    n_subject = np.unique(subject).shape[0]
    n_segment = np.unique(segment).shape[0]

    with numpyro.plate("n_segment", n_segment, dim=-1):
        with numpyro.plate("n_subject", n_subject, dim=-2):
            a = numpyro.sample('a', dist.Normal(3, 1))
            b = numpyro.sample('b', dist.Normal(3, 1))

            c = numpyro.sample('c', dist.Normal(9, 1))

            p = numpyro.sample('p', dist.Uniform(0, 1))
            q = numpyro.sample('q', dist.Bernoulli(probs=p))

    mean = \
        q[subject, segment] * jnp.minimum(jnp.maximum(
            0, b[subject, segment] * (x - a[subject, segment])
        ), c[subject, segment]) + \
        (1 - q[subject, segment]) * jax.nn.relu(b[subject, segment] * (x - a[subject, segment]))

    with numpyro.plate("data", len(x)):
        return numpyro.sample("obs", dist.TruncatedNormal(mean, .5, low=0), obs=y_obs)

# MCMC
nuts_kernel = NUTS(model)
mcmc = MCMC(nuts_kernel, num_chains=4, num_warmup=2000, num_samples=4000)
rng_key = jax.random.PRNGKey(0)
mcmc.run(rng_key, x, subject, segment, y)
posterior_samples = mcmc.get_samples()
Gives the error
ValueError: Expected the joint log density is a scalar, but got (240,). There seems to be something wrong at the following sites: {'_pyro_dim_2'}.