hi  I’m trying to generate a sample from my distribution with similar proportions/similar trend as I have in observed data
how would I do so?
right now I only can just do a sample from my data with the same distribution, but not the same trend:
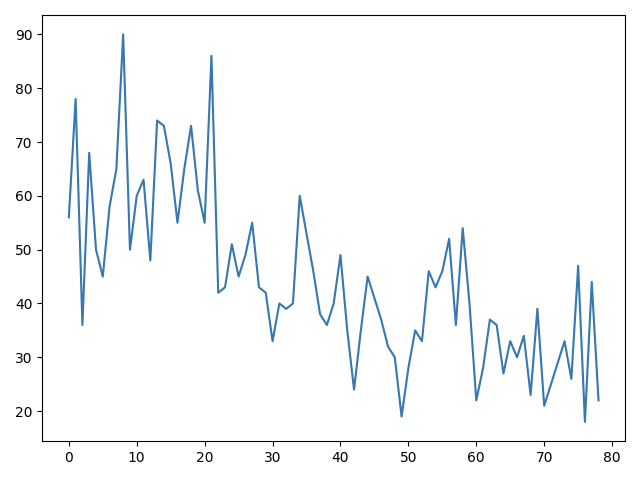
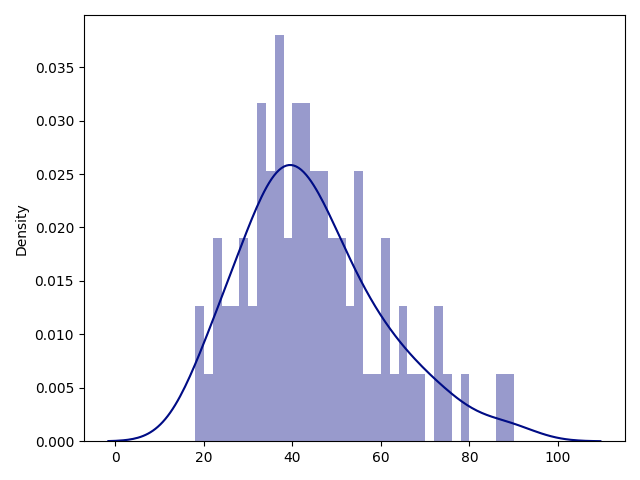
my data:
generated data:
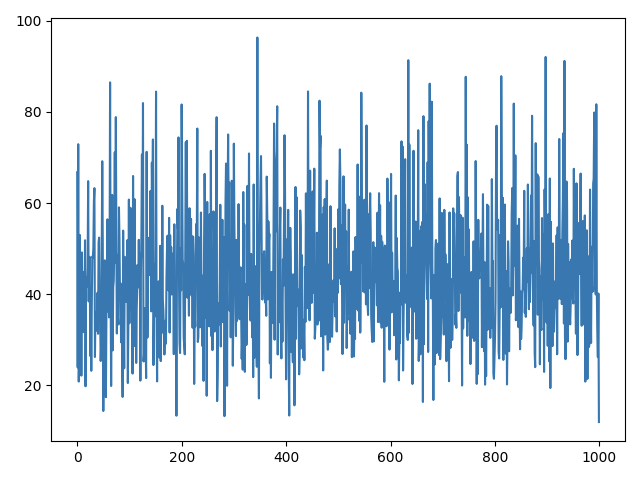
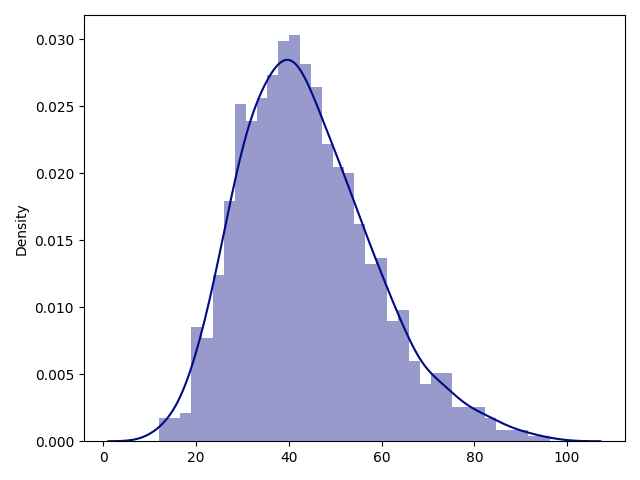
so it’s only similar in it’s value distribution, not in it’s proportions
here is my code:
import matplotlib.pyplot as plt
import seaborn as sns
import numpy as np
import pyro.distributions as dist
import torch
import pyro
from pyro.infer import MCMC, NUTS

obs = [56.0, 78.0, 36.0, 68.0, 50.0, 45.0, 58.0, 65.0, 90.0, 50.0, 60.0, 63.0, 48.0, 74.0, 73.0, 66.0, 55.0, 65.0, 73.0, 61.0, 55.0, 86.0, 42.0, 43.0, 51.0, 45.0, 49.0, 55.0, 43.0, 42.0, 33.0, 40.0, 39.0, 40.0, 60.0, 53.0, 46.0, 38.0, 36.0, 40.0, 49.0, 35.0, 24.0, 35.0, 45.0, 41.0, 37.0, 32.0, 30.0, 19.0, 28.0, 35.0, 33.0, 46.0, 43.0, 46.0, 52.0, 36.0, 54.0, 40.0, 22.0, 28.0, 37.0, 36.0, 27.0, 33.0, 30.0, 34.0, 23.0, 39.0, 21.0, 25.0, 29.0, 33.0, 26.0, 47.0, 18.0, 44.0, 22.0]

obs = torch.from_numpy(np.array(obs))
plt.plot(obs);
plt.show()

sns.distplot(obs, hist=True, kde=True,bins=int(180 / 5), color='darkblue')
plt.show()

def get_checkins_params(data):
    alpha = 1.0 / data.mean()
    lambda_1 = pyro.sample("lambda_1", dist.Exponential(alpha))
    lambda_2 = pyro.sample("lambda_2", dist.Exponential(alpha))

    with pyro.plate("data", data.size(0)):
        pyro.sample("obs", dist.Gamma(lambda_1, lambda_2), obs=data)

kernel = NUTS(get_checkins_params, jit_compile=True, ignore_jit_warnings=True, max_tree_depth=3)
posterior = MCMC(kernel, num_samples=5000, warmup_steps=500)
posterior.run(obs);
params = posterior.get_samples(50)
alpha_param=np.mean(params['lambda_1'].detach().cpu().numpy())
beta_param = np.mean(params['lambda_2'].detach().cpu().numpy())

g = dist.Gamma(alpha_param, beta_param)
distr = g.sample((1, 1000)).detach().cpu().numpy()[0]

plt.plot(distr);
plt.show()
sns.distplot(distr, hist=True, kde=True, bins=int(180 / 5), color='darkblue')
plt.show()
so my goal is to get a sample where there are also bigger values in the beginning of a trend and more lower the closer it is to the end (as in the input data)