Fitting a model with a multimodal posterior using flows and NeuTra HMC

I am using the latest branch so the NS samples should be resamples correctly.

Setting depth=1 results in the blue mode around u0=5 being dominant. I don’t think this is right because the likelihood in the orange mode (around u0=-4) is higher:


and the dynesty posterior also gives more weight to the orange mode. It seems that jaxns is currently particularly sensitive to tuning, at least for this problem.

The fact that the relative heights between the modes are so sensitive to tuning and also the data makes me think that stacking based on cross validation scores is the better approach here.

@fbartolic this seems to be a good case to use as a test case for improving jaxns. I can compute the exact solution using a special version of jaxns, which will take much longer but be 100% correct, then I’ll use that as a reference for seeing what it is about the default version that has troubles. I’ll post this as an issue in jaxns and tag you.

2 Likes

@fbartolic can you share those data files required to run your model?

Ah found them in your repo

@joshuaalbert When the next version is released, please tag me too. I’ll update the pr in numpyro for reviewing. Thanks! :slight_smile:

This is the result of super accurate inference.
Takes about 3 minutes not including jit compile.

Does this look right @fbartolic ?

Yep, this seems to match the output of dynesty with the static nested sampler option.

@fbartolic Can you clarify what you mean by truth in this comment? Does it means that you know what the posterior should be (perhaps semi-analytically)?

It seems that there is at least one very small extra mode in the u0 marginal (perhaps another), and that nested sampling is missing it because of what’s called “cluster death”. If not enough live points are used then small mass modes – which typically have negligable impact on the evidence – can be undersampled and they can evaporate. The only way to overcome is crank up the live points. This is a limitation of nested sampling as a gradient-free method, however it’s positive benefit is that it’s able to freely tunnel between modes and the modes that get dropped are often of little value as far as hypothesis testing goes. Some tricks up our sleeves might be able to help with such cluster deaths though.

@fbartolic Can you clarify what you mean by truth in this comment? Does it means that you know what the posterior should be (perhaps semi-analytically)?

Sorry, I should have been clearer, I don’t have the exact posterior nor do I know the true parameters.
The parameters (u0, t0, piEE, piEN) describe the trajectory of a star on the sky relative to a fixed origin point. The multimodality in the posterior is a consequence of the fact that there are several nearly symmetric plausible trajectories. In reality, the star took one path and I want to accurately quantify the probability of each of the 4 paths. The Bayesian posterior will provide those probabilities but the particular ranking might be sensitive to the details of the noise model. Stacking chains based on cross validation scores should do better, at least if my reading of Yao et.al. 2020 is correct. If this is indeed the case it should be possible to demonstrate with simulated data that the stacked posterior is better calibrated in some sense than the Bayesian posterior.

It seems that there is at least one very small extra mode in the u0 marginal (perhaps another), and that nested sampling is missing it because of what’s called “cluster death”. If not enough live points are used then small mass modes – which typically have negligable impact on the evidence – can be undersampled and they can evaporate. The only way to overcome is crank up the live points. This is a limitation of nested sampling as a gradient-free method, however it’s positive benefit is that it’s able to freely tunnel between modes and the modes that get dropped are often of little value as far as hypothesis testing goes. Some tricks up our sleeves might be able to help with such cluster deaths though. If you look at the likelihood plots they’re substantially lower in likelihood

I didn’t know about cluster death, thanks for explaining it. I don’t think that’s responsible for the fact that we don’t see the inner two modes in the jaxns posterior in this particular case though. These modes also have noticeably lower likelihood (see plot in the previous post) so jaxns is correctly downweighting them I think.

Hello,
I may be late (too) but I have just tried use the current Numpyro/NestedSampler for this quite interesting example. Following the discussion if I am right I have done this

from numpyro.contrib.nested_sampling import NestedSampler
ns = NestedSampler(model, num_live_points=2000, max_samples=2e5, depth=5, num_slices=3)
ns.run(random.PRNGKey(0), t, F, Ferr)
ns.print_summary()

I get first,

--------
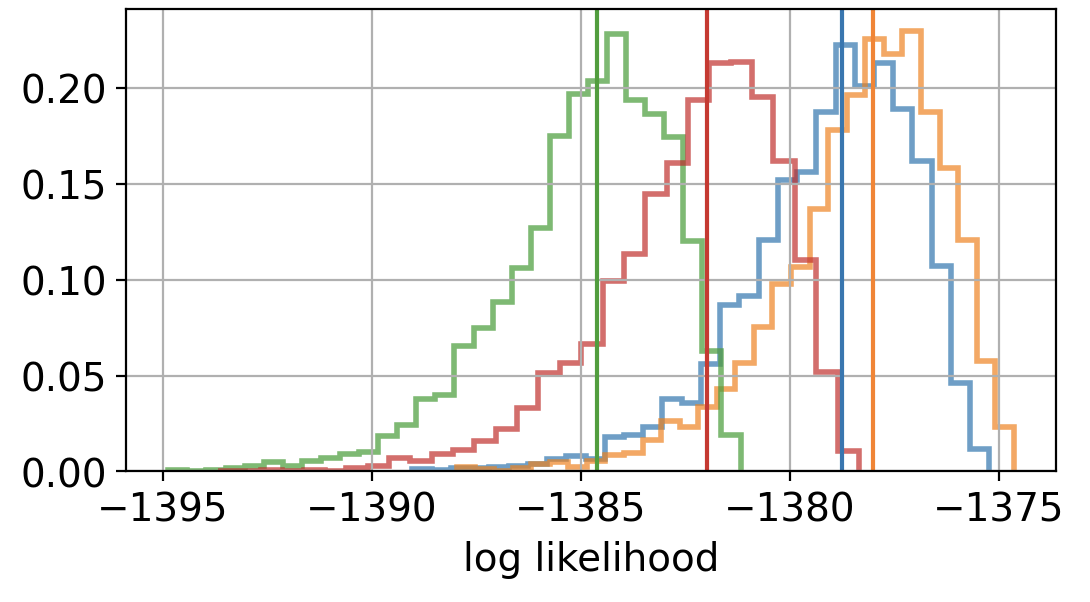
# likelihood evals: 4000
# samples: 18355
# likelihood evals / sample: 0.2
--------
logZ=-3255.62 +- 0.058
ESS=2051

but then the code crash with the following last message

TypeError: percentile requires ndarray or scalar arguments, got <class 'list'> at position 1.

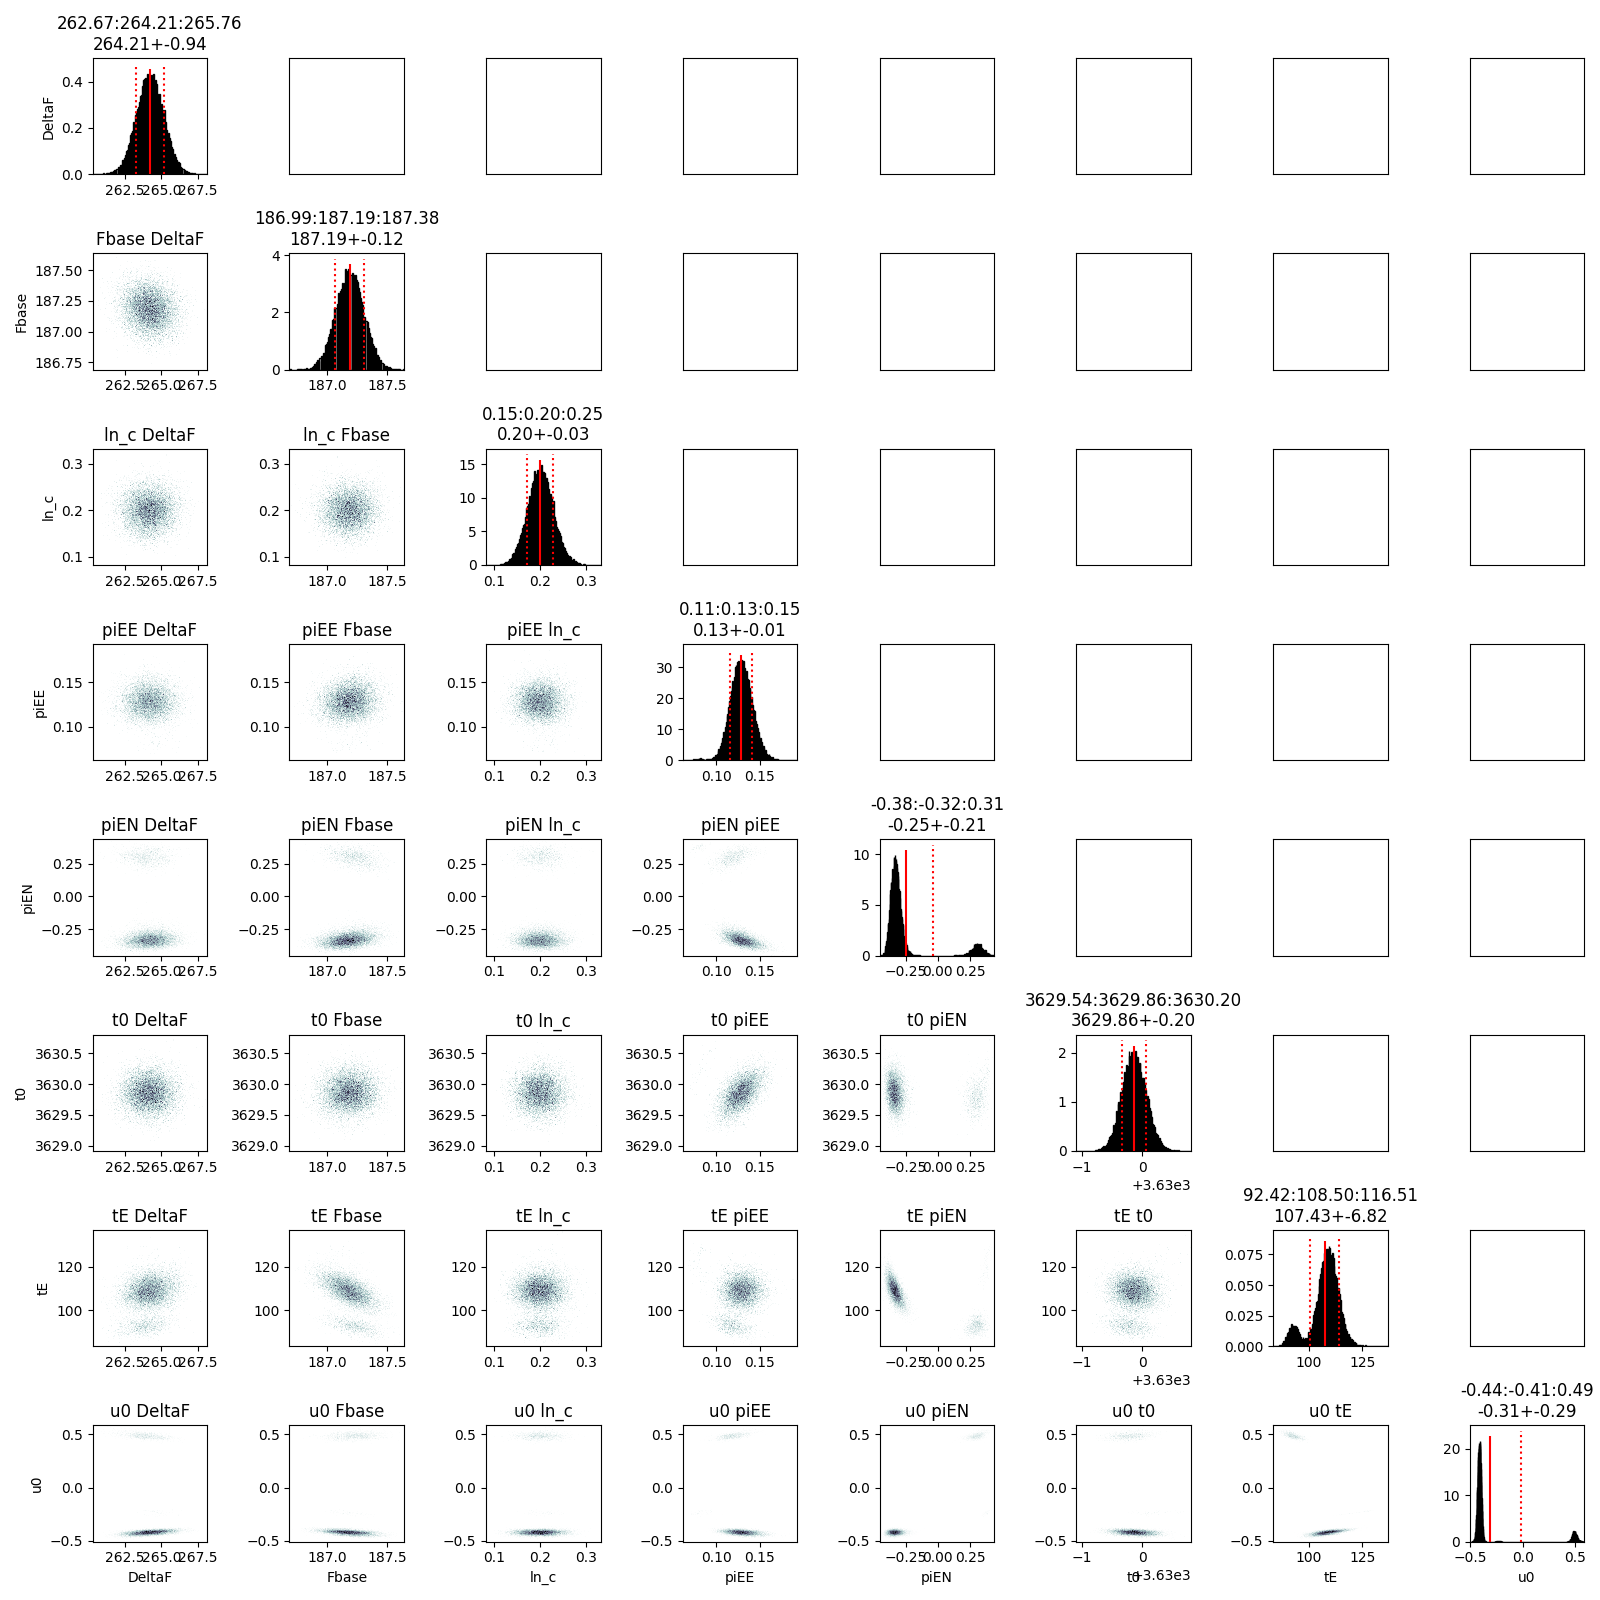
I think this is related to the following issue

samples = ns.get_samples(random.PRNGKey(1), 10000)
samples

one gets

{'ln_DeltaF': DeviceArray([-6.073782, -6.073782, -6.073782, ..., -6.073782, -6.073782,
              -6.073782], dtype=float32),
 'ln_Fbase': DeviceArray([5.2849283, 5.2849283, 5.2849283, ..., 5.2849283, 5.2849283,
              5.2849283], dtype=float32),
 'ln_c': DeviceArray([3.1351554, 3.1351554, 3.1351554, ..., 3.1351554, 3.1351554,
              3.1351554], dtype=float32),
 'ln_tE': DeviceArray([12.814183, 12.814183, 12.814183, ..., 12.814183, 12.814183,
              12.814183], dtype=float32),
 'piEE': DeviceArray([-0.26583126, -0.26583126, -0.26583126, ..., -0.26583126,
              -0.26583126, -0.26583126], dtype=float32),
 'piEN': DeviceArray([0.16695724, 0.16695724, 0.16695724, ..., 0.16695724,
              0.16695724, 0.16695724], dtype=float32),
 't0': DeviceArray([3578.5566, 3578.5566, 3578.5566, ..., 3578.5566, 3578.5566,
              3578.5566], dtype=float32),
 'u0': DeviceArray([0.1378763, 0.1378763, 0.1378763, ..., 0.1378763, 0.1378763,
              0.1378763], dtype=float32)}

which is a unique point repeated all the time.

Is there something I missed to get NS working properly. (nb. NUTS/AutoBNAFNormal at least runs even if only 1 blob is found)
Thanks

I guess it will be fixed in 1.0. See this PR.

Ok but

  1. how you got the nice 2 blobs results using NS with num_live_points=2000, max_samples=2e5, depth=5, num_slices=3
  2. Do you know also what were the NUTS parameters to get it right also?

Release 1.0 is almost ready. Stay tuned.

@fehiepsi Release 1.0,0 is out!

1 Like

Thanks @joshuaalbert I’ll update the wrapper accordingly.