Hi everyone,
I’ve been playing with the example in the Forecasting III: hierarchical models tutorial and I wanted to extend the model to include the following additions:
- Yearly seasonality
- Holidays effects
- Missing data
For point 1, I managed to incorporate yearly seasonality by adding the following code within the origin plate:
with pyro.plate("year", 52, dim=-1):
    year_seasonal = pyro.sample("year_seasonal", dist.Normal(0, 5))
    assert year_seasonal.shape[-2:] == (data_dim, 52)
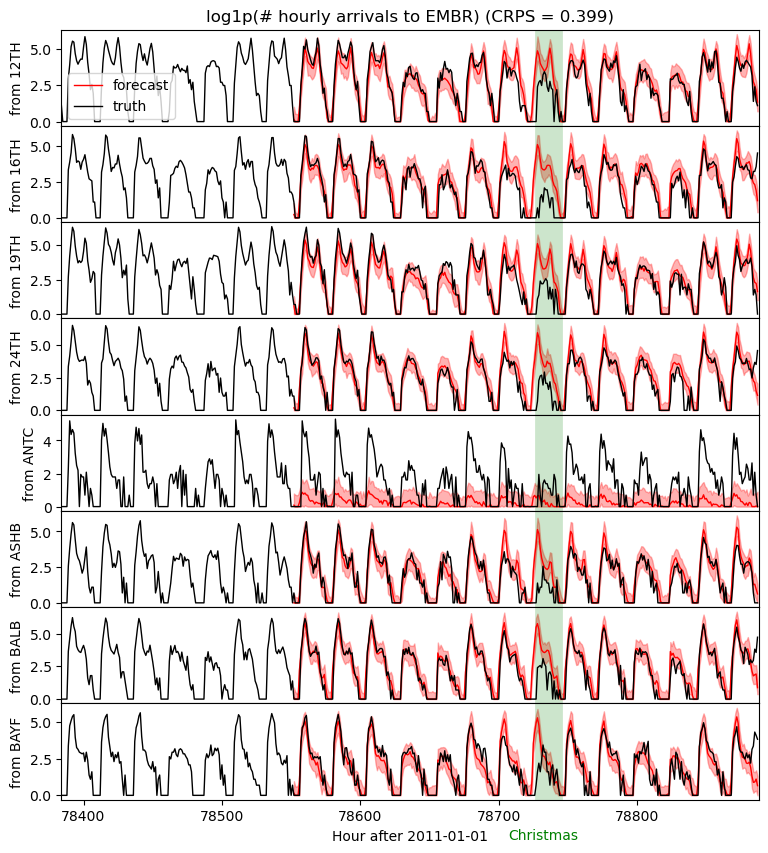
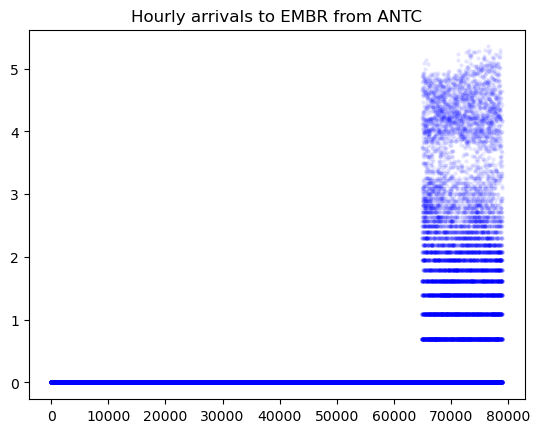
However, I’m not completely sure what’s the best way to do points 2 and 3. The reason for adding these can be shown in the following plot. You can notice two things. First, the Christmas effect (green region) is not nicely captured. Second is that the forecasting accuracy for the time series From ANTC (5th plot) got worse. This happened because I used the whole history instead of just the last 90 days of data. It turns out that this station has only been active for roughly two years during the nine years of historical data.
So far, my idea is to incorporate the required information to model Christmas and missing data in the covariates argument. However, I dunno how to deal with the following scenarios:
- A global Christmas effect shared across all stations,
- A local Christmas effect for each station,
- A local missing data effect for just one station.
Any ideas are appreciated!