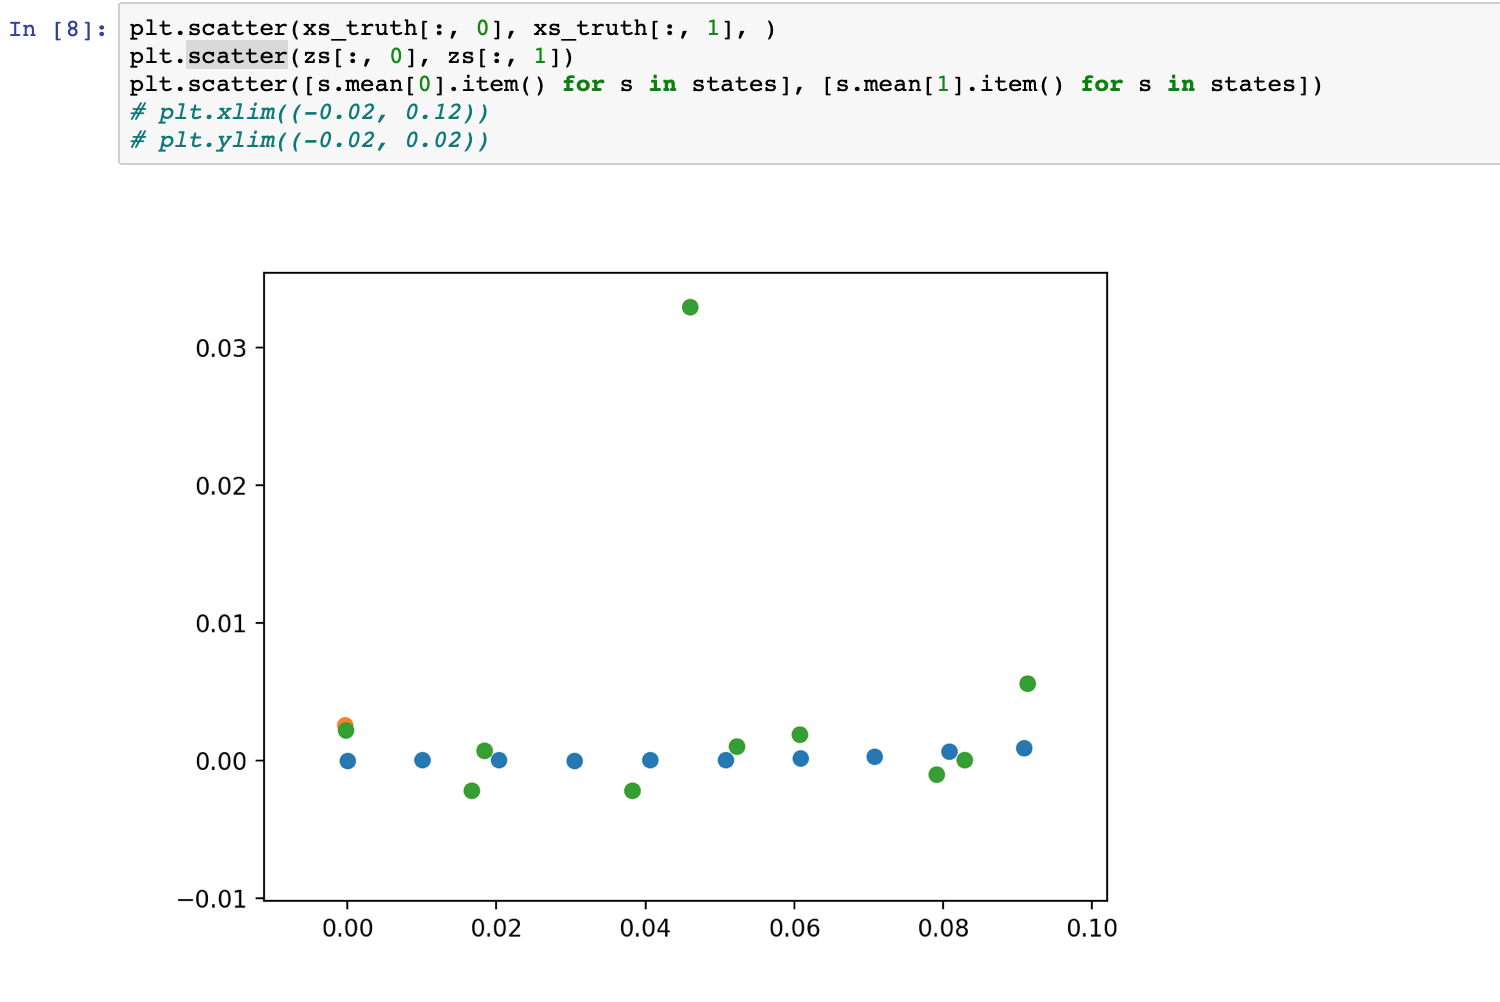
I am learning about Kalman filters and trying to extend the tutorial a little bit. I have added a few notes and started playing with parameters to try to understand what is going on better. Here is my plot so far:
-
My first question is, why is the code used to generate the plot not included? Having this code would go a long way in helping beginners play around with the tutorial.
-
The number of dimensions looks like it is set at 4. I’m not sure why this is because I think we are just plotting using 2 dimensions. The author also claims there are 100 time steps yet it is set at 10.
-
In my plot, it is hard to tell the difference between noisy signal and the predictions from the filter. As you can see, the measurements and state predictions overlap. I replaced one of the measurements with an outlier:
zs[3] = torch.tensor([ 0.0460, 0.033]), yet the filter is unaffected in predicting state. The optimizer also converges in a few iterations. Enabling a bit more noise in the predictions would help show how the Kalman Filter is modeling the measurement uncertainty -
In general, in all of these tutorials, I would like to see the tuning knobs explicitly set at the top of the notebook and maybe a short description as to how they effect the sampling distributions or parameters.