I’ve been trying to monitor convergence of model parameters using the cosine similarity between changes of parameter values. The basic idea is as follows. If the variational parameters are very far from the optimum, the optimizer will consistency push the parameters in the right direction and the similarity between changes is large. If the variational parameters are close to the optimum, updates are less consistent as we bounce around the optimum, and the cosine similarity is small.
More formally,
where \theta_t are the parameters at epoch t, \delta_t is the change from \theta_{t-1} to \theta_t after having run one epoch, and \rho_t is the cosine similarity between changes fro successive epochs.
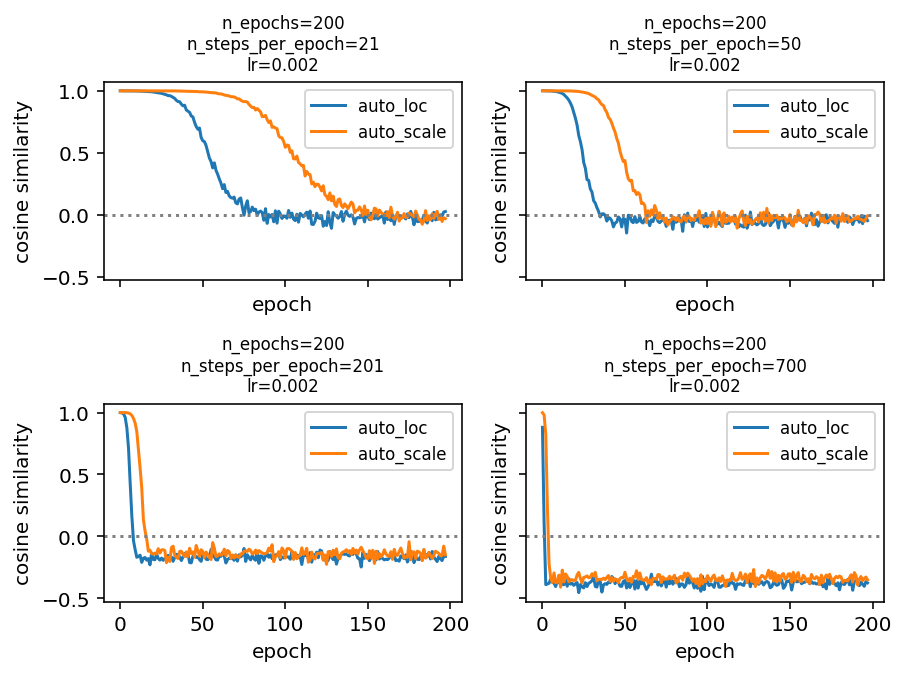
What I expected to see is that we start of with \rho_1\approx 1 and find \rho_t bouncing around 0 for large t. What I actually observe is that \rho_t becomes—and consistently stays—negative if the number of steps per epoch is large enough. Do you have any ideas what might be going on here?
I’ve created a reproducible example here for a simple model x\sim\mathsf{Normal}(0, 1) for x\in\mathbb{R}^{1,000}. The plot of cosine similarity against epoch number looks like this using an AutoDiagonalNormal guide.
A few hypotheses I’ve tested and ruled out:
- Maybe the optimizer steps back and forth over the optimum with each iteration (not epoch) if the learning rate is too large. But I observe the same behavior for even and odd numbers of steps per epoch, so that’s probably not it.
- Maybe it’s something to do with the optimizer, but I observe the same behavior for
adamandsgdfrom theoptaxpackage. - Maybe I’ve picked the number of iterations per epoch “just right” so the parameters walk from one side to the other side of the optimum. But I observe the same behavior for different number of iterations per epoch.
- Maybe it’s got something to do with dimensionality, but I observe the same behavior for x\in\mathbb{R}^{100}.
Any insights would be much appreciated! Pretty sure my logic is flawed somewhere. Thanks for your time.