I have a question on visualising dependency between r.v. in Pyro.
Is there an easy way I can plot the dependency graph of the variables? I am trying to work with Bayesian Networks, and sometimes they get too large and complex to understand using pyros plates, especially since Pyro assumes dependency between every r.v. and the previous one.
To check my understanding of Pyros plate, I am trying to model the following system:
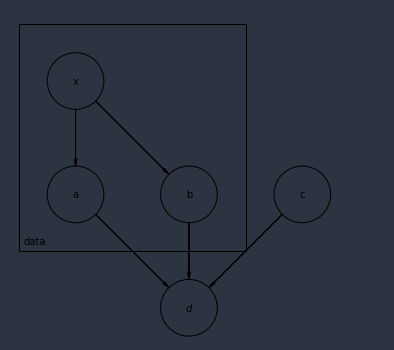
Is this model fine?
def model(data):
    x_prior_a = pyro.sample('x_prior_a', dist.Uniform(0, 1))
    # etc.. assume all numbers from now are just priors. Priors aren't dependent on each other
    with pyro.plate("high_level", 2):
        x = pyro.sample('x', dist.Beta(x_prior_a, 1))
        with pyro.plate("data", len(data)):
            a = pyro.sample('a', dist.Normal(10, 2))
            b = pyro.sample('b', dist.Beta(1, 1))
        c = pyro.sample('c', dist.Uniform(0, 10))
      d = pyro.sample('d', dist.Normal(a + b - C, 5), obs=true_function(data))
  return x,c,a,b,d
or should I be a lot more explicit with my plates?
def model2(data):
    x_prior_a = pyro.sample('x_prior_a', dist.Uniform(0, 1))
    # etc.. assume all numbers from now are just priors. Priors aren't dependent on each other
    with pyro.plate('c_plate', 1):
         c = pyro.sample('c', dist.Uniform(0, 10))
    data_plate =  pyro.plate('data', len(data), dim=-2)
    with data_plate:
      with pyro.plate('first_plate', 1):
        a = pyro.sample('a', dist.Normal(10, 2))
      with pyro.plate('second_plate', 1):
        b = pyro.sample('b', dist.Beta(1, 1))
      # d is still in data_plate context
      d = pyro.sample('d', dist.Normal(a + b - C, 5), obs=true_function(data))
  return x,c,a,b,d
Is there a way to disable automatic dependency in pyro?
Many thanks!