I’ve been starting to learn pyro by applying different inference methods to a Gaussian mixture model (GMM). I am confused about the bad results I’m getting when using importance sampling with a guide fit using SVI to infer the cluster means.
Here are the model and data definitions (taken from tests/infer/mcmc/test_hmc.py):
K = 2

@config_enumerate(default="parallel")
def gmm(data):
    mix_proportions = pyro.sample("phi", dist.Dirichlet(torch.ones(K)))
    with pyro.plate("num_clusters", K):
        cluster_means = pyro.sample("cluster_means",
                                    dist.Normal(torch.arange(float(K)), 1.))
    with pyro.plate("data", data.shape[0]):
        assignments = pyro.sample("assignments", dist.Categorical(mix_proportions))
        pyro.sample("obs", dist.Normal(cluster_means[assignments], 1.), obs=data)
    return cluster_means

# Generate data
N = 100
true_cluster_means = torch.tensor([1., 5.])
true_mix_proportions = torch.tensor([0.4, 0.6])
cluster_assignments = dist.Categorical(true_mix_proportions).sample(torch.Size((N,)))
data = dist.Normal(true_cluster_means[cluster_assignments], 1.0).sample()
I want to infer cluster_means. Next, define the guide and fit with SVI:
def gmm_guide(data):
    weight_param = pyro.param("weight_param", torch.ones(K),
                              constraint=constraints.positive)
    mix_proportions = pyro.sample("phi", dist.Dirichlet(weight_param))

    # Fine-tuned initializations
    mean_param = pyro.param("mean_param", torch.tensor([0.9, 3.1]))
    scale_param = pyro.param("scale_param", 0.5*torch.ones(K),
                             constraint=constraints.positive)
    with pyro.plate("num_clusters", K):
        cluster_means = pyro.sample("cluster_means", dist.Normal(mean_param, scale_param))

# Fit guide and create posterior
pyro.clear_param_store()
svi = SVI(model=gmm, guide=gmm_guide,
          optim=optim.Adam({"lr": 0.01, "betas": [0.8, 0.99]}),
          loss=TraceEnum_ELBO(max_plate_nesting=1))

for t in range(3000):
    svi.step(data)

guided_importance_run = Importance(gmm, gmm_guide, num_samples=500).run(data)
guided_posterior = EmpiricalMarginal(guided_importance_run, sites=["cluster_means"])
The SVI loss seems to converge reasonably well.
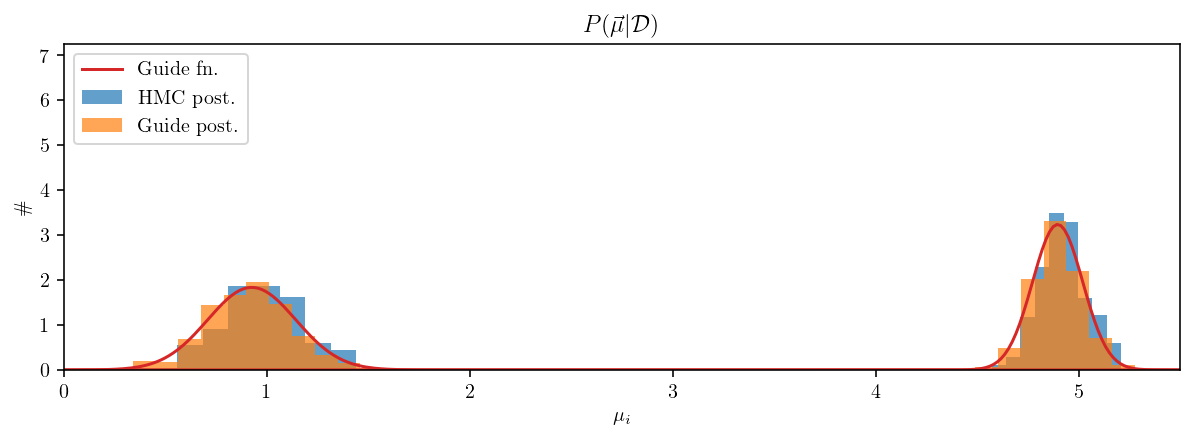
Now I’m drawing 500 samples of cluster_means from guided_posterior and plotting the distributions of the two components. For comparison, I’m also plotting draws from a posterior computed with HMC/MCMC. I’m also visualizing the guide function by plotting two Gaussians with means and standard deviations given by the components of mean_param and scale_param. Here is the result:
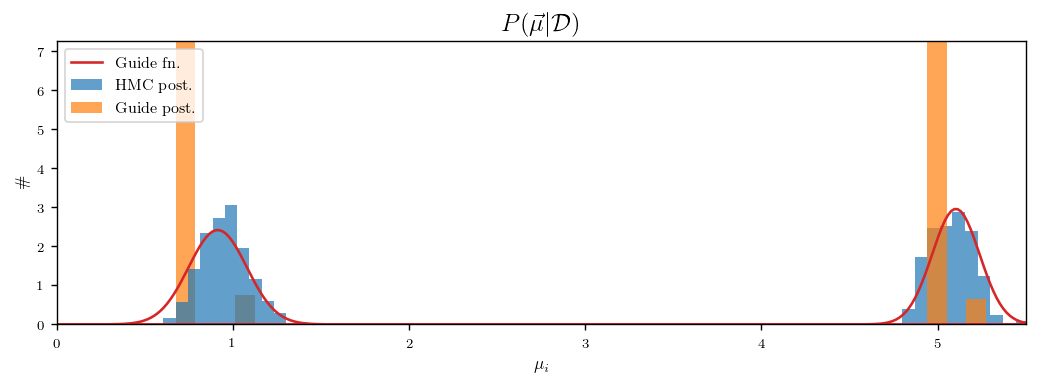
I am confused about this plot. All the draws from guided_posterior are the same, even though the guide nearly matches the HMC posterior. The draw is the just highest-probability point from the importance sampling run and is not particularly close to the guide’s mode. Why is this happening?